receiver operating characterstics curve
- related: Biostats
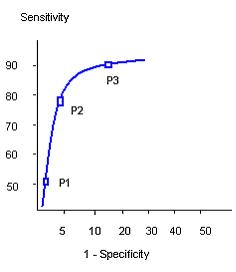
A new serum marker shows promise in the early diagnosis of colon cancer. It represents a fetal antigen that has minimal expression in healthy adults, but has increased expression in those with colon cancer. Various serum concentration levels (P1, P2, and P3) are tested as cutoff points for diagnosis of disease. The sensitivity and specificity of the test at each of these serum concentrations is then compared to the gold standard (excisional biopsy). The following curve is constructed.
Which of the following is the best statement concerning this new test?
The curve shown in Question #5 is called a receiver operating characteristic (ROC) curve. It illustrates the tradeoff between sensitivity and specificity which is made when choosing a cutoff value for positive and negative test results. In this example, the P3 cutoff point shows high sensitivity and low specificity, whereas the P1 cutoff point shows low sensitivity and high specificity. As seen in Fig. 4, this means that P3 is closer to point A (100% sensitivity) than to point B and P1 is closer to point B (100% specificity) than to point A. Based on these observations, it can be concluded that P3 corresponds to a lower serum marker value than does P1.
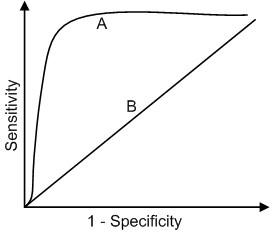
The area under ROC represents accuracy of the test (the number of true positives plus true negatives divided by the number of all observations). An accurate test would have area under the ROC close to 1.0 (rectangular shape) whereas a test with no predictive value would be represented by a straight line (see Fig. 5).
Fig. 5. Two receiver operating characteristic (ROC) curves are shown. Curve A has area under the curve close to 1.0 and represents an accurate test. Curve B has area under the curve of 0.5 and lacks predictive value.
Another important indicator of test performance is the likelihood ratio. The positive likelihood ratio is calculated by dividing sensitivity by (1-specificity). A positive likelihood ratio of 9 indicates that a positive test result is seen 9 times more frequently in patients with the disease than in patients without the disease. Unlike predictive values, the likelihood ratio is independent of disease prevalence.

